Introduction
Canva Statistics: Canva was founded in 2013 by Melanie Perkins, Cliff Obrecht, and Cameron Adams with the clear mission to simplify graphic design and make it accessible to everyone, regardless of their expertise. Originating from Perth, Australia, the platform was built with an easy-to-use drag-and-drop interface that removes the complexity traditionally associated with design software.
Today, Canva stands as a global visual communication platform used by a diverse community of more than 220 million monthly active users in over 190 countries. Since its inception, Canva users have created in excess of 30 billion designs on the platform. The scale of daily design activity is remarkable, with tens of millions of designs generated every day, reflecting Canva’s widespread adoption and integral role in empowering creativity across various individual and professional use cases.
Top Editor’s Choice
- Canva has over 240 million monthly active users, reflecting its widespread global adoption for visual content creation.
- Users aged 25 to 34 make up 28.64% of the platform’s audience, showing strong traction among young professionals and creators.
- More than 85% of Canva’s users are outside the U.S., confirming its global-first approach and international user appeal.
- Around 15.72% of web traffic originates from the U.S., making it the platform’s single largest country by traffic, but not the majority.
- Canva’s revenue reached over USD 2.4 billion in 2024, with annualized revenue now surpassing USD 3 billion, underscoring consistent monetization through premium offerings.
- The company is valued at approximately USD 40 billion in 2025, reflecting investor confidence in its scalable business model and product-led growth.
- Over 21 million paying users subscribe to Canva Pro, indicating strong demand for advanced features and collaborative tools.
- More than 30 billion designs have been created since its launch, with around 80 new designs produced every second, showing real-time engagement at massive scale.
- The platform operates in over 190 countries and supports more than 100 languages, enabling hyper-localized design across diverse markets.
- Canva offers more than 610,000 templates and over 150 million stock photos and graphics, making it one of the richest content libraries for non-designers.
- Small businesses form a large portion of Canva’s user base, drawn by affordability and ease of branding.
- About 95% of Fortune 500 companies use Canva, confirming its credibility among enterprise users.
- The platform employs approximately 5,000 people globally, supporting its operations, design, and tech infrastructure.
- 55% of users identify as female, and Canva is widely adopted across professionals, educators, and students alike.
- Its mobile app has crossed 120 million downloads, emphasizing mobile-first usage patterns.
- Canva integrates with over 100 apps and platforms, enhancing its workflow compatibility and team productivity.
- The platform processes billions of design elements each month, while daily tutorials and events reach millions, supporting community-led learning.
- Over 80% of users rate its ease of use as excellent, reinforcing its appeal as an intuitive design tool for all skill levels.
Timeline
- 2013: Canva officially launched after raising seed funding, with a waiting list of over 50,000 people.
- 2014: Expanded outside Australia, launched design marketplace and iPad app.
- 2015: Introduced Canva for Work (Canva Pro) for professionals in 200,000+ companies.
- 2016: Launched iPhone app, expanded team, and introduced first non-English language (Spanish).
- 2017: Reached first year of profitability; launched Canva Print, animations, Android app, and 100 languages.
- 2018: Launched Canva Presentations, acquired Zeetings, and launched in China.
- 2019: Rolled out Canva Enterprise, Canva Apps, Canva for Education; acquired stock photo sites Pexels and Pixabay.
- 2020: Opened first US office in Austin, Texas; launched Canva Video and Desktop App; recognized as top cloud computing company.
- 2021: Acquired Smartmockups and Kaleido; updated logo and branding; committed to net-zero carbon by 2040.
- 2022: Hosted first global event Canva Create; launched Visual Suite; acquired Flourish.
- 2023: Launched AI Magic Studio and Canva for Campus; opened offices in London and Melbourne.
- 2024: Introduced Canva Enterprise; acquired Leonardo.AI and Affinity (Serif); 1.7 million people listed Canva as a core skill on LinkedIn.
Recent Developments
- In 2024, Canva launched Magic Studio, a powerful suite of AI tools including Magic Write, Magic Design, and Magic Animate, enabling faster content generation and creative automation for users across skill levels.
- Visual Suite 2.0 was introduced, unifying Docs, Whiteboards, Presentations, Websites, and AI features into a single collaborative workspace, streamlining content workflows.
- Canva Sheets debuted as a visual-first spreadsheet tool, integrating storytelling and design into data, making it easier to build presentation-ready tables and charts.
- Canva Code was launched in late 2024, allowing users to create interactive web apps using natural language, pushing Canva beyond static design into dynamic app creation.
- The company acquired MagicBrief and Affirm.ai, strengthening its capabilities in AI storytelling, team collaboration, and workflow enhancement for content teams.
- By early 2025, the Canva App Marketplace surpassed 1,000 apps, with key integrations like Slack, Google Drive, and Microsoft Teams, expanding Canva’s functionality across enterprise and productivity platforms.
Canva Web Traffic Statistics
| Metric | July 2025 |
|---|---|
| Total Visits | 821.25 million |
| Average Session Duration | 14 minutes 50 seconds |
| Pages per Visit | 5.87 |
| Bounce Rate | 31.17% |
| Traffic from Direct | 78.42% |
| Traffic from Organic Search | 11.43% |
| Top Countries | United States, Brazil, India |
(reference: semrush, similarweb, ahrefstop)
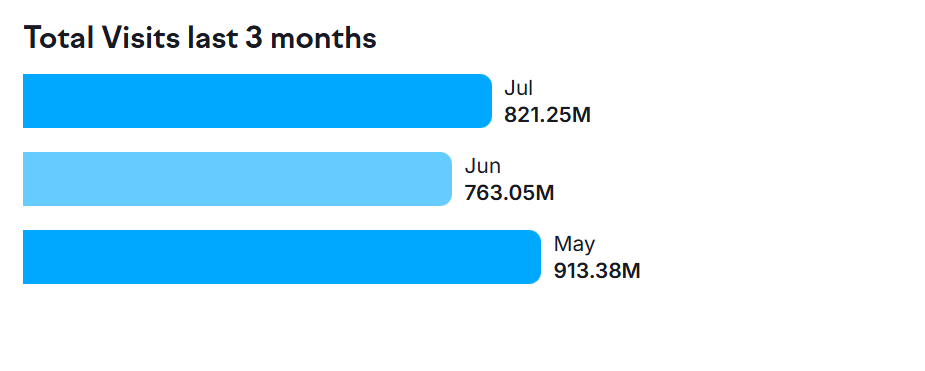
Visitor Engagement
- May recorded the highest traffic with 913.38 million visits, showing strong global engagement.
- June saw a decline to 763.05 million visits, marking a noticeable dip in activity.
- July recovered slightly with 821.25 million visits, reflecting renewed user activity after the June slowdown.
(source: semrush.com)
Canva Monthly Active Users
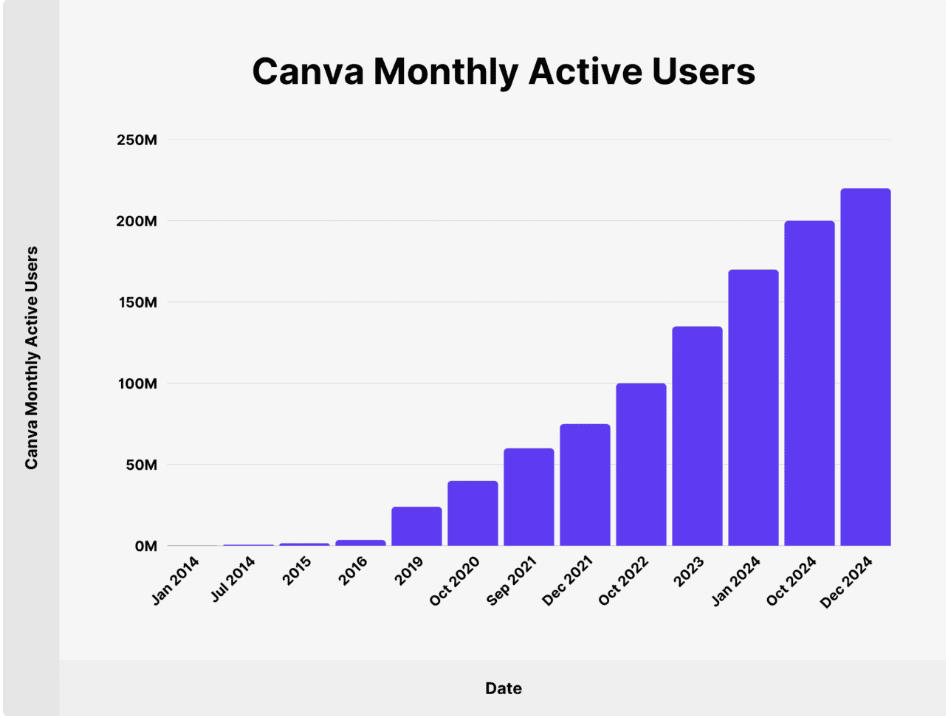
Canva Monthly Active Users Over Time
| Date | Canva Monthly Active Users |
|---|---|
| January 2014 | 150 thousand |
| July 2014 | 600 thousand |
| 2015 | 1.5 million |
| 2016 | 3.6 million |
| 2019 | 24 million |
| October 2020 | 40 million |
| September 2021 | 60 million |
| December 2021 | 75 million |
| October 2022 | 100 million |
| 2023 | 135 million |
| January 2024 | 170 million |
| October 2024 | 200 million |
| December 2024 | 220 million |
(Source: Canva, backlinko.com)
Traffic by Country
- The United States leads with 138.11 million visits, accounting for 16.82% of global traffic, with a strong desktop preference at 84.86%.
- Brazil ranks second with 67.59 million visits (8.23%), showing a similar trend where 86.6% of users access via desktop.
- India recorded 64.97 million visits (7.91%), but stands out with a higher 23% share from mobile, highlighting mobile-first engagement.
- Indonesia contributed 41.46 million visits (5.05%), with 24.1% mobile share, making it one of the most mobile-driven markets.
- The Philippines generated 38.01 million visits (4.63%), with the highest desktop usage at 88.49%, reflecting strong reliance on non-mobile access.
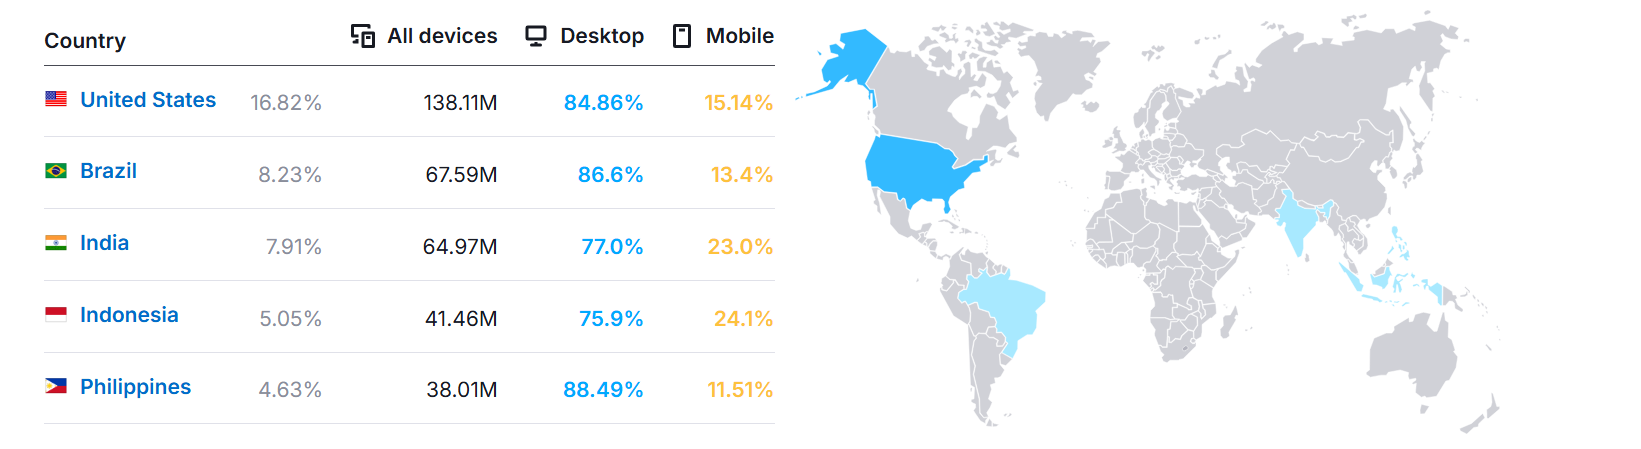
(source: semrush.com)
Traffic Share by Device
- Desktop dominates usage with a clear majority, accounting for more than 80% of total visits, showing Canva’s strong alignment with professional and workplace users.
- Mobile traffic remains below 20%, indicating limited reliance on smartphones compared to other digital platforms.
- Overall traffic peaked above 1 billion visits in early months but showed a dip around April before stabilizing close to 800M–900M visits by July.
- Desktop traffic mirrors the overall trend, confirming it is the main driver of Canva’s global engagement.
- Mobile traffic has remained relatively steady, suggesting consistent but secondary usage, primarily for quick access and on-the-go edits.
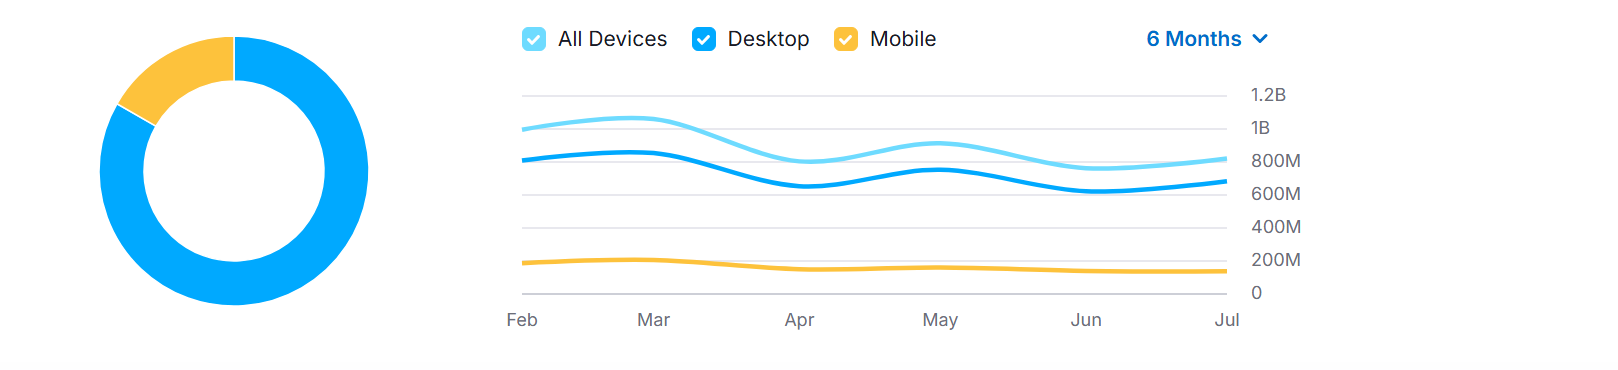
(source: semrush.com)
Traffic Sources
- Direct traffic dominates with 604.98M visits (79%), showing strong brand recognition and habitual user engagement.
- Organic search contributes 103.92M visits (14%), highlighting Canva’s strong visibility in search results.
- Referral traffic stands at 32.27M (4%), indicating notable inbound visits from partner sites and external links.
- Organic social generates 16.18M visits (2%), reflecting moderate engagement from unpaid social media activity.
- Paid channels remain minimal, with paid social at 152.6K, paid search at 2.67M, and display ads at 305.2K, showing Canva relies far more on brand strength than paid campaigns.
- Mail traffic accounts for 2.37M visits, contributing a very small share to total traffic.
Top Organic Keywords
- “Canva” dominates with 16.6M monthly searches, holding 39.11% of total traffic share, and a high CPC of $3.46, reflecting strong brand-driven demand.
- “Canvas” attracts 3.35M searches, but only contributes 2.44% traffic share, largely due to mixed intent with the LMS platform.
- “Canva login” sees 823K searches, with a low CPC of $0.17, showing strong navigational intent from existing users, contributing 1.93% traffic.
- “Docs” generates 3.35M searches, but Canva ranks in position 3, capturing 0.8% traffic share, indicating competition with Google Docs and other document platforms.
- “AI image generator” records 823K searches, ranking Canva in position 2, with a CPC of $0.82 and 0.31% traffic share, reflecting growing interest in Canva’s AI design features.
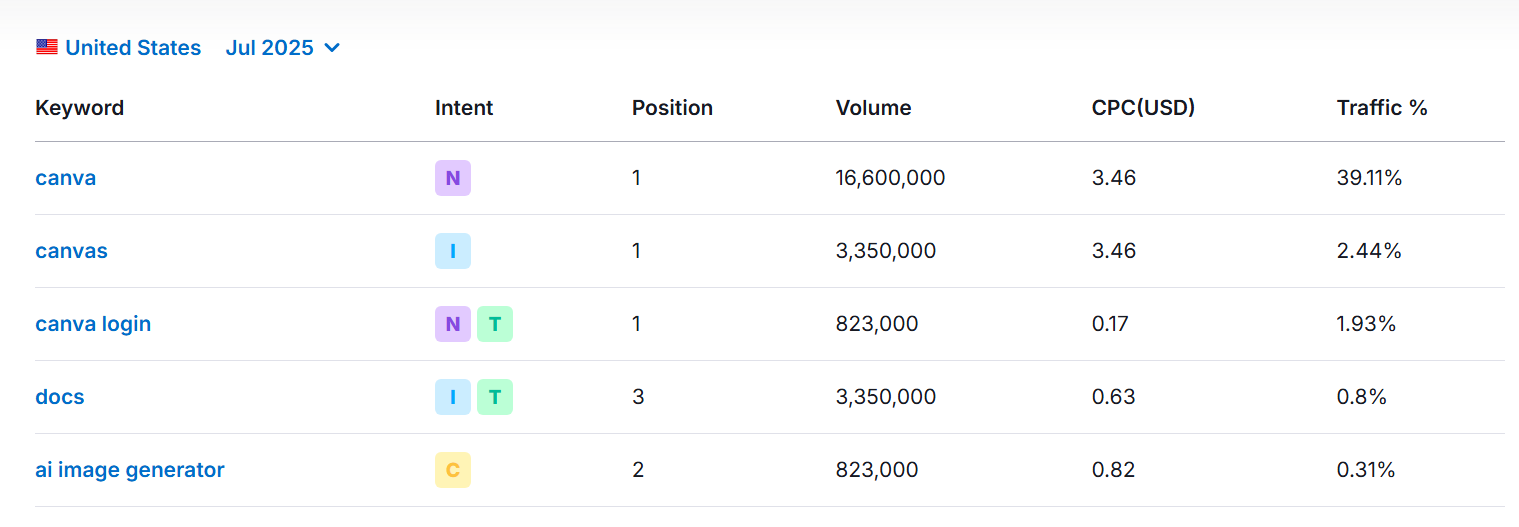
(source: semrush.com)
Canva User Demographics
- Gender distribution shows female users dominate at 58.25%, while male users account for 41.75%, reflecting Canva’s stronger appeal among women.
- The largest age group is 25-34 years, representing 28.93% of users, highlighting Canva’s popularity among young professionals and creators.
- Users aged 18–24 account for 20.14%, indicating strong adoption among students and early-career individuals.
- The 35–44 age group makes up 20.37%, showing steady engagement from mid-career professionals.
- Older age segments see declining shares: 45–54 years at 14.93%, 55-64 years at 9.99%, and 65+ at 5.64%.
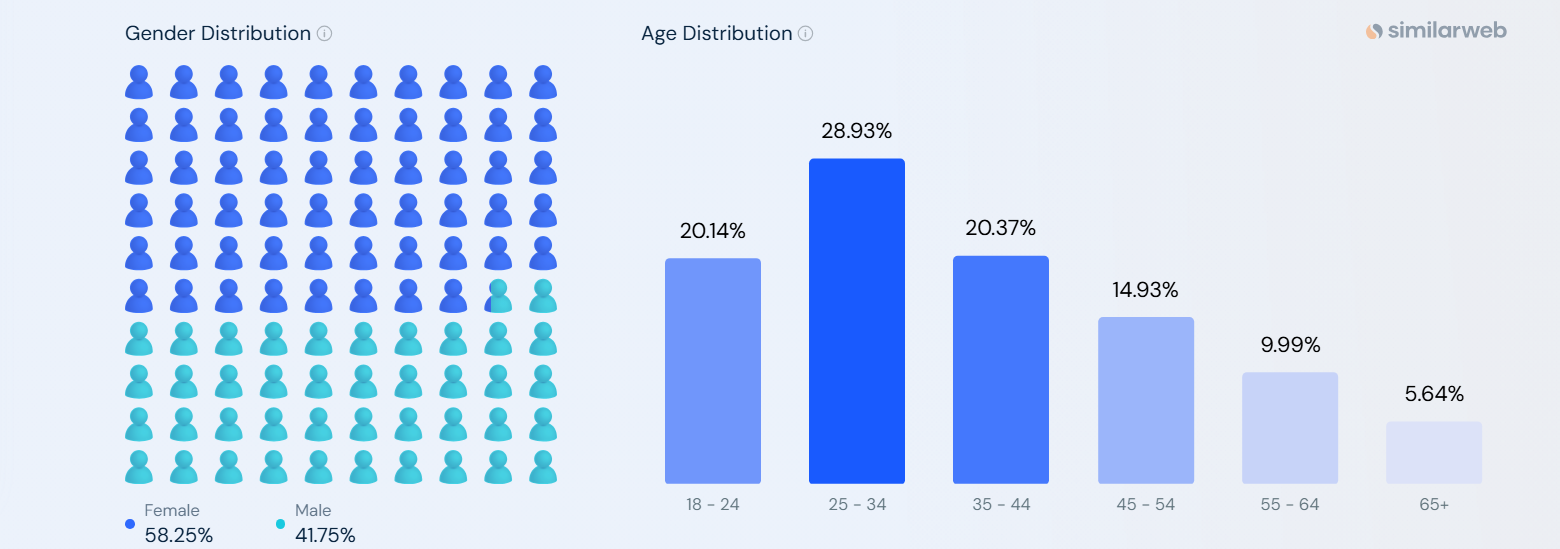
(source: similarweb)
Comparative Market Share of Canva
- Adobe Photoshop leads with 41.74% share, maintaining its dominance as the industry standard for professional graphic design.
- Adobe InDesign follows with 26.13%, reflecting its strength in publishing and layout design markets.
- Adobe Illustrator holds 12.25%, driven by its role in vector graphics and branding design.
- Canva secures 10.26% share, establishing itself as a major player by offering ease of use, accessibility, and affordability compared to traditional software.
- SketchUp stands at 3.78%, primarily serving architectural and 3D design professionals.
- Smaller shares are held by Cinema 4D (1.67%), CorelDRAW (1.34%), and Adobe Lightroom (1.32%), catering to niche creative segments.
- OmniGraffle (0.71%) and QuarkPress (0.31%) remain marginal, serving specialized user bases.
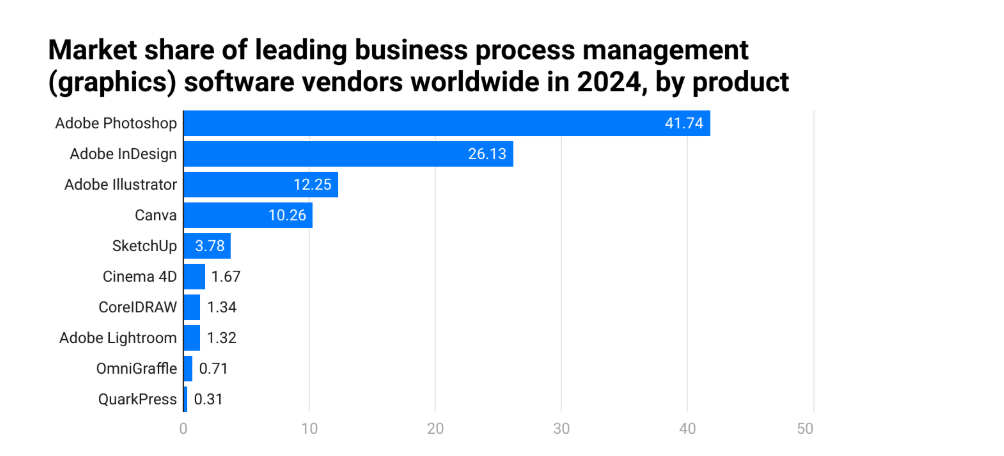
(source: electroiq.com)
Canva Revenue
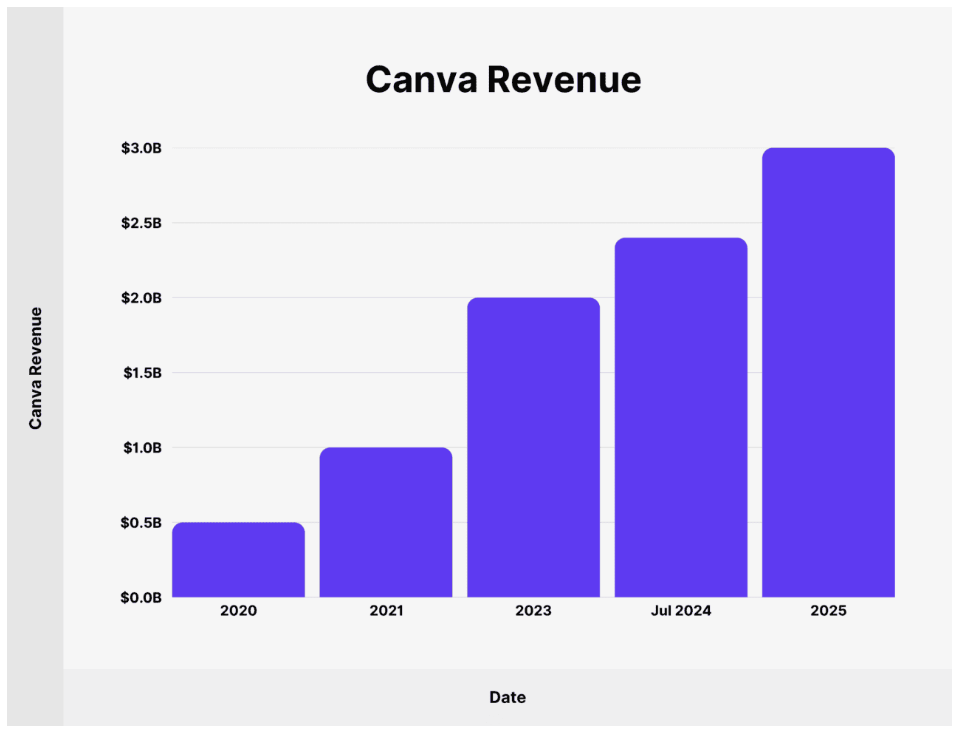
(source: peedyincomeformula.com)
Top Industries Adopting Canva
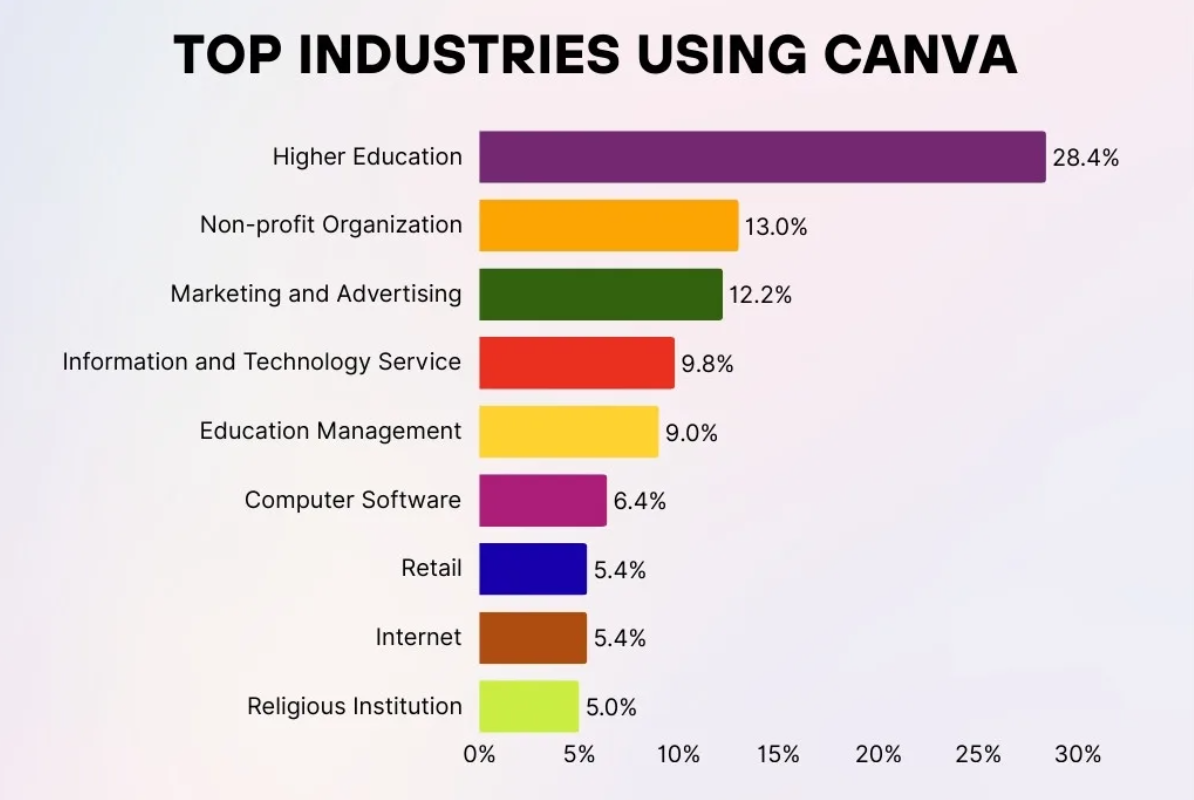
(source: sqmagazine.co.uk)
Business Usage Statistics
- 90% of Fortune 500 companies use Canva, highlighting its strong presence in enterprise design and brand communication.
- Over 800,000 teams pay for subscriptions, showing wide adoption of Canva’s premium collaboration features.
- 585,000 nonprofit organizations actively use the platform, leveraging its accessibility for cost-effective design and outreach.
- Higher education institutions represent 28.4% of usage, reflecting Canva’s role in academic communication, projects, and teaching support.
- Marketing companies account for 12.2% of usage, underlining Canva’s importance in digital campaigns, branding, and content creation.
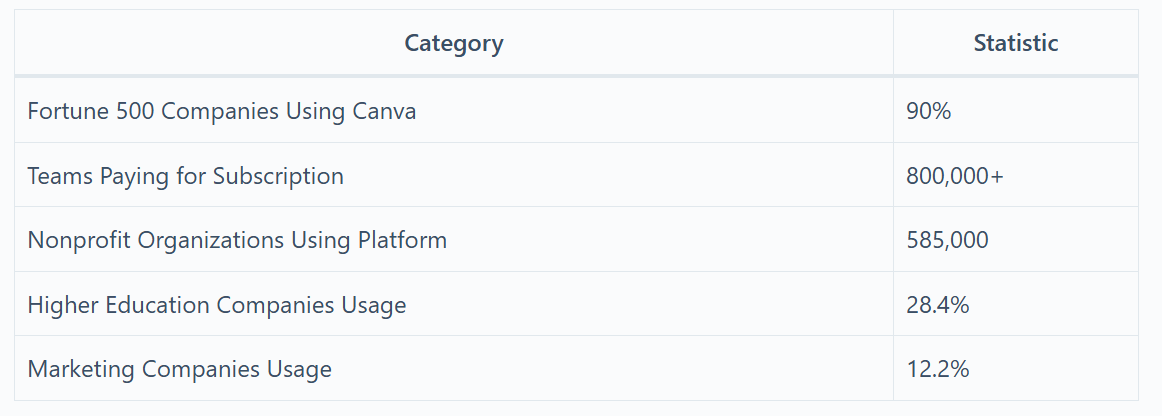
(reference: dataglobehub.com)
Design Creation and Usage
- Over 30 billion designs have been created since 2012, showcasing Canva’s scale as a global design platform.
- In 2024, 38.5 million designs are created daily, reflecting deep integration into everyday professional and personal workflows.
- Design creation increased 50% year-over-year, rising from 20 billion in 2023 to 30+ billion by 2024, highlighting accelerating adoption.
- 1.85 billion presentations were created by May 2024, underlining Canva’s growing role in workplace communication and education.
- The U.S. contributed 3.8 billion designs in 2024, making up 13% of total global output, a strong indication of regional dominance.
- An average of 80 designs were created every second in 2023, demonstrating real-time, high-volume engagement at scale.
Canva and Competitors: Market Analysis
| Platform/Metric | Canva | Adobe Suite | Microsoft PowerPoint |
|---|---|---|---|
| Graphics Market Share | 12.47% | 70% | N/A |
| Presentation Software | 46% | N/A | 23% |
| Monthly Active Users | 220 million | ~26 million | ~1.2 billion |
| Fortune 500 Adoption | 95% | ~85% | ~98% |
| Target Audience | Everyone | Professionals | Business Users |
| Annual Pricing (Individual) | $120 (Pro) | $240+ (Creative Cloud) | $69 (Standalone) |
(Sources: ElectroIQ, CropInk, DemandSage)
Conclusion
In Conclusion, Canva has grown beyond a simple design tool into a comprehensive creative platform that balances simplicity with power. Its large and loyal user base, strong financial performance, and presence in global markets make it a standout name in the industry.
For anyone looking to understand current trends in digital design and marketing tools, Canva’s 2025 statistics offer a clear picture of what success looks like in this space. The company’s ability to connect with users at all levels and continue evolving its product suggests that it will remain a dominant force in visual content creation for years to come.
Sources:
- https://talkbitz.com/canva-statistics/
- https://ahrefstop.com/websites/canva.com
- https://www.similarweb.com/website/canva.com/
- https://www.semrush.com/website/canva.com/overview/
- https://whop.com/blog/canva-statistics/
- https://backlinko.com/canva-users
- https://sqmagazine.co.uk/canva-statistics/
- https://www.answeriq.com/canva-statistics/
- https://persuasion-nation.com/canva-statistics/
- https://www.designyourway.net/blog/canva-statistics/
- https://enlyft.com/tech/products/canva
- https://dataglobehub.com/canva-statistics-and-insights/
- https://electroiq.com/stats/canva-statistics/
- https://www.demandsage.com/canva-statistics/