
Introduction
Subscription Economy Statistics: The subscription economy has emerged as one of the most transformative shifts in modern commerce, reshaping how businesses and consumers engage with products and services. What began with streaming platforms and software solutions has now expanded into industries such as food delivery, fitness, fashion, and mobility. This shift reflects a broader change in consumer behavior, where long-term access and flexibility are valued over outright ownership.
For businesses, this model provides recurring revenue streams and stronger customer relationships, creating stability and opportunities for continuous growth. According to findings from Bango, the average American spends around $924 per year on subscriptions, highlighting the scale of adoption and the willingness of consumers to integrate multiple recurring services into their daily lives. This level of spending demonstrates how deeply embedded the subscription economy has become, not only as a business strategy but also as a lifestyle choice for millions of consumers.
At its core, the subscription economy is defined by recurring payments that grant consumers access to goods or services, replacing the traditional one-time purchase model. This structure emphasizes convenience, personalization, and ongoing engagement. The key driver behind its rise is the move from ownership to access, allowing consumers to enjoy regular updates, curated experiences, or on-demand availability.
Top Editor’s Choice
- According to Market.us, The Global Subscription Economy Market is projected to grow significantly, with an estimated market size of USD 2,129.92 billion by 2034, up from USD 487.0 billion in 2024. This impressive growth is driven by a robust CAGR of 15.9% from 2025 to 2034.
- The global subscription market is expected to reach $1.5 Trillion in 2025, reflecting its rapid expansion across industries.
- Streaming services alone will generate $155 Billion by 2025, reinforcing their role as a major growth driver.
- Digital subscriptions contribute over 40% of total revenue, holding the largest share of the subscription economy.
- 75% of adults believe subscriptions will continue to replace ownership, signaling a lasting behavioral shift.
- Subscription businesses have grown 4.6x faster than the S&P 500, proving stronger long-term resilience.
- The U.S. dominates with 53% of global digital subscriptions, making it the largest consumer base.
- By vertical share: E-commerce 10%, SaaS 8%, Social media subscriptions 8%, News & Magazines 7%, Content streaming 5%, Subscription boxes 1%, and Loyalty market 1%.
- In 2024, over 87% of consumers used streaming services, with 50% paying for subscriptions.
- Subscriptions per user rose 25%, increasing from 2.4 to 3 per subscriber, reflecting stronger multi-service adoption.
- Average consumer spending on streaming rose 30%, from $48 in 2023 to $61 in 2024.
- Physical products are projected to account for 45% of subscription market value, showing strong potential beyond digital services.
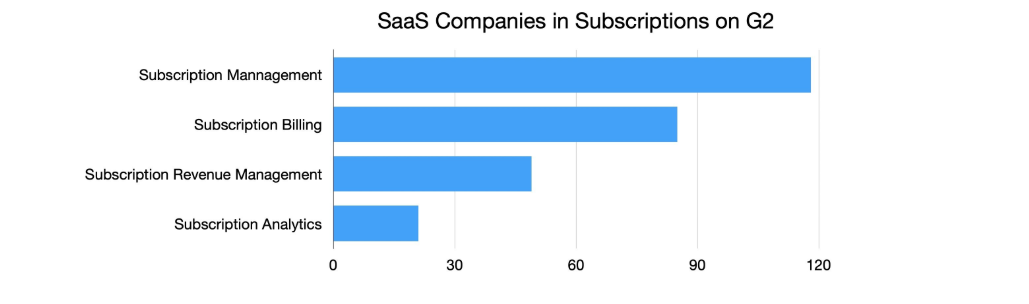
- Subscription and Billing Management stands at $10.5 Billion, highlighting demand for scalable billing solutions.
 (source: namiml.com)
AI’s Impact on the Subscription Economy
- AI is driving real-time personalization in subscriptions, meaning offers and recommendations are tailored to individual user behavior and preferences, which leads to higher engagement and better retention rates.
- Businesses use AI-powered predictive analytics to spot early signs of customer churn, letting them act promptly to prevent cancellations and build stronger loyalty.
- Dynamic pricing enabled by AI lets companies adjust subscription costs based on market trends and user habits, making prices more competitive and perceived as fairer for customers.
- AI automates customer support through chatbots and virtual assistants, resolving issues instantly and handling a high volume of requests without human staff, improving user satisfaction.
- Security and billing processes benefit from AI’s ability to detect fraud and streamline payments automatically, protecting both revenue and customer data.
- Subscription management systems are now using AI to suggest better plan options, optimize value, and help users combat subscription fatigue by evaluating usage and offering deals proactively.
- With the rise of AI, B2B businesses prioritize digital customer experience, with over 80% marking it as their main focus for innovation and growth in 2025.
- AI is helping companies adapt subscription offerings dynamically in response to user feedback and market changes, making the experience more flexible and customer-centric than ever before.
Streaming Subscription Statistics
- The global streaming market is booming, valued at over $670 billion in 2025 and expected to grow to $2.49 trillion by 2032.
- There are roughly 1.8 billion streaming subscriptions worldwide, with around 36% of all TV usage now from streaming, surpassing cable and broadcast.
- The average user spends more than 3 hours daily streaming video content, with weekly time spent on OTT platforms rising to 17 hours.
- Netflix alone boasts over 200 million subscribers globally, showcasing the high demand for video streaming services.
- Mobile streaming accounts for over 60% of global consumption, reflecting growing preference for on-the-go viewing.
- In 2024, over 87% of consumers used streaming services, making it a daily habit.
- Around 50% paid for subscriptions, showing strong loyalty to premium content.
- The top paid platforms were Netflix, Spotify, and Disney+, combining video and music demand.
- Subscriptions per user rose from 2.4 to 3, a 25% increase, as consumers added more platforms.
Social Media Subscription Statistics
- As of 2025, social media users worldwide have reached 5.31 billion, nearly 64% of the global population, growing at a steady 4.7% year-over-year.
- People spend an average of 2 hours and 20 minutes daily on social media, engaging actively across about 6.7 platforms monthly.
- The rise of AI-driven content and virtual influencers is reshaping social media marketing. For instance, AI-generated content helps 90% of businesses save time and 73% improve engagement.
- In 2024, YouTube Premium stood out with 100 million subscribers, reflecting its strong appeal for ad-free viewing and bundled music access.
- Snapchat+ attracted 7 million subscribers, showing that younger audiences are willing to pay for enhanced social media experiences.
- Twitter (X) secured around 640,000 premium subscribers, indicating limited but growing demand for exclusive platform features.
- Meta Verified (Facebook) reached an estimated 12 million subscribers, highlighting the value users place on verification and credibility tools.
- Reddit Premium surpassed 530,000 subscribers, proving that niche communities also hold monetization potential when paired with ad-free engagement.
Digital Subscription Statistics
- Total digital subscriptions globally reached an estimated 923 million in Q1 2025, up from 917 million in Q1 2024, showing steady ongoing demand.
- The subscription economy overall is predicted to exceed $1.5 trillion globally by 2025, growing 435% in the past decade.
- In digital media, ad-supported subscriptions have risen to 28% of total, while ad-free have declined to 36%, indicating cost-conscious consumer behavior.
- Subscription bundling is increasingly popular with 58% of subscribers opting for bundled SVOD services, up significantly from last year.
- The U.S. accounts for 53% of all digital subscription consumption, underscoring its dominance in the market.
(source: whop.com)
App Subscription Statistics
- App subscriptions generated approximately $45.6 billion in revenue in 2023, with the U.S. contributing more than half that value.
- On mobile devices, 70% of all digital media time is spent in apps, and the average smartphone owner uses about 10 apps daily and 30 per month.
- App subscription retention varies – annual subscriptions retain about 41%, monthly about 20%, signaling the importance of long-term user engagement strategies.
- Around 96% of app spending on iOS and Google Play comes from subscriptions, showing the dominance of recurring revenue in app monetization.
Monetization strategies, by category
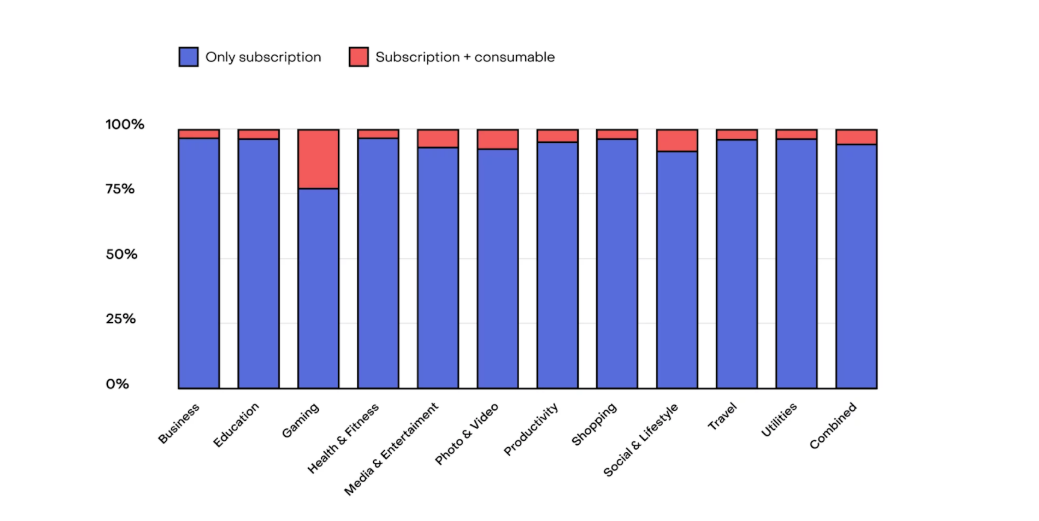
(Source: whop.com)
Subscription Revenue Statistics
- Netflix generated $39 billion in revenue in 2024, up 15.7% compared to the previous year, reflecting continued subscriber growth and monetization success.
- The broader subscription economy is set to surpass $1.5 trillion globally by 2025, driven by recurring revenue models across multiple sectors beyond media, including software, food, and fashion.
- Hybrid monetization models that combine subscriptions with advertising are becoming more common to diversify revenue streams and target different consumer segments.
- In-app subscriptions and streaming continue to be major contributors to overall recurring revenue growth.
Subscription Acquisition Statistics
- Acquisition rates for subscription services have declined from 4.1% in 2021 to 2.8% in 2024, signaling greater competition and market saturation.
- Return acquisitions (customers who re-subscribe after cancellation) now represent about 20% of new subscribers, emphasizing the value of retention strategies.
- Customer acquisition costs (CAC) have risen significantly, with entertainment companies facing CACs of around $200 to $300, driven by high digital ad prices and competitive bidding.
- Marketers are shifting focus to smarter, data-driven personalized campaigns rather than broad advertising, using AI and subscriber cohort analysis to optimize acquisition.
Subscription Retention Statistics
- Retention rates vary by subscription type – yearly plans see the highest retention around 44-60% at 12 months, monthly plans show 17-20%, and weekly plans generally below 5-10% at six months.
- Social and lifestyle apps suffer from lower retention compared to media, entertainment, and travel categories, pointing to challenges in sustaining engagement.
- Flexible subscription options like pause features grew by 68% year-over-year, with paused subscribers generating over $200 million through reactivation.
- Offering customizable plans and multiple billing frequencies correlates with better retention and subscriber satisfaction.
Subscription Consumer Statistics
- Consumers in 2025 are highly discerning and exhibit “churn-and-return” behavior, frequently canceling and re-subscribing based on ongoing value perception.
- Price sensitivity has risen, leading more users to prefer ad-supported or discounted subscriptions, with over 28% of users sticking to services that offer cheaper, ad-supported alternatives.
- Consumers value personalization, content variety, and seamless user experience. Around 72% of users report satisfaction with streaming services, and 93% intend to maintain or increase subscriptions.
- Binge-watching is common, with 26% of users binge-watching at least weekly, underscoring how engagement drives retention and subscription value.
Key Subscription Benchmarks
- High-growth subscription startups recorded an average MRR growth rate of 15–30% annually, while early-stage SaaS firms achieved even higher levels with 20–50% annual growth. This demonstrates the scalability of recurring revenue when product-market fit is strong.
- Churn rates differ sharply by segment. B2B SaaS enterprises maintained 5–7% annual churn with enterprise clients, while SMBs experienced 15–25%, reflecting greater volatility. On the consumer side, digital media subscriptions faced 6–8% monthly churn, whereas subscription boxes performed better with 3–5% monthly churn, showing stronger stickiness in tangible offerings.
- Customer acquisition costs remained significant. B2C subscriptions averaged $150–$250 per subscriber, while B2B SaaS required a CAC payback period of 12–18 months, emphasizing the need for long-term retention to recover initial investments.
- Customer lifetime value provided a clearer return picture. B2B SaaS achieved CLTV of 3–5x CAC, while consumer subscription businesses averaged $400–$700 per customer, reflecting predictable long-term revenues when retention is managed well.
- Conversion rates highlighted the challenge of freemium models. Freemium SaaS converted only 3–7% of users to paid tiers, while paid trials converted 30–60%, proving the higher effectiveness of upfront commitment models.
- Retention metrics showed the strength of SaaS economics, with Net Revenue Retention (NRR) between 100–130%, supported by upsells and expansions. Consumer services achieved annual subscriber retention of 75–85%, which underscores the importance of consistent engagement strategies to limit churn.
(Reference: subsgrowth.com)
Subscription Economy Market Size
The global subscription economy market is anticipated to grow from USD 487.0 billion in 2024 to approximately USD 2,129.92 billion by 2034, advancing at a CAGR of 15.9% during 2025–2034. This expansion is being fueled by consumers’ rising preference for access over ownership, with demand spreading across industries such as media, software, retail, mobility, and food services. The steady and predictable revenue model not only strengthens business sustainability but also enhances consumer experiences through personalization, flexibility, and convenience.
Key insights Summary
- The U.S. subscription economy was valued at USD 207.70 Billion in 2024, projected to rise to USD 232.21 Billion in 2025 and further expand to USD 633.66 Billion by 2034, growing at a steady 11.8% CAGR.
- Content Subscriptions dominated in 2024 with over 45% share, highlighting the rising consumer preference for digital content, streaming, and on-demand media.
- The Media & Entertainment industry led with more than 40% share, driven by strong adoption of streaming services, gaming platforms, and digital media consumption.

(Credit: market.us)
Subscription Economy Industry by Region
- In Europe, the subscription economy is set to grow from 0.56 trillion dollars in 2023 to 1.17 trillion dollars in 2033, supported by favorable regulations and strong consumer acceptance of digital services.
- The Asia Pacific market will rise from 0.37 trillion dollars in 2023 to 0.78 trillion dollars in 2033, driven by higher incomes, growing internet access, and strong demand for digital content and apps.
- In North America, the market is forecasted to expand from 0.64 trillion dollars in 2023 to 1.35 trillion dollars in 2033, supported by widespread SaaS adoption and a high concentration of technology companies.
- South America is expected to grow from 0.13 trillion dollars in 2023 to 0.27 trillion dollars in 2033, with growth supported by digital payments and the expansion of e-commerce platforms.
- The Middle East and Africa will see an increase from 0.20 trillion dollars in 2023 to 0.43 trillion dollars in 2033, fueled by digital transformation programs and a rising start-up ecosystem.
(source: consainsights.com)
Subscription E-Commerce Market Statistics
- The global subscription e-commerce market will grow from 20.7 billion dollars in 2024 to 68.42 billion dollars by 2034, at a 12.7 percent CAGR. Growth is driven by convenience and personalized shopping demand.
- In 2024, North America held 36.5 percent share, generating 7.5 billion dollars. The U.S. contributed 6.42 billion dollars with an expected 9.4 percent CAGR, supported by strong digital adoption and recurring delivery demand.
- By type, product subscriptions made up 38.6 percent, led by food, personal care, and household items. By industry, retail held 28.8 percent, as brands use subscriptions for loyalty and steady revenue.
- By payment frequency, monthly plans dominated with 48.7 percent, showing consumers prefer short and flexible commitments.
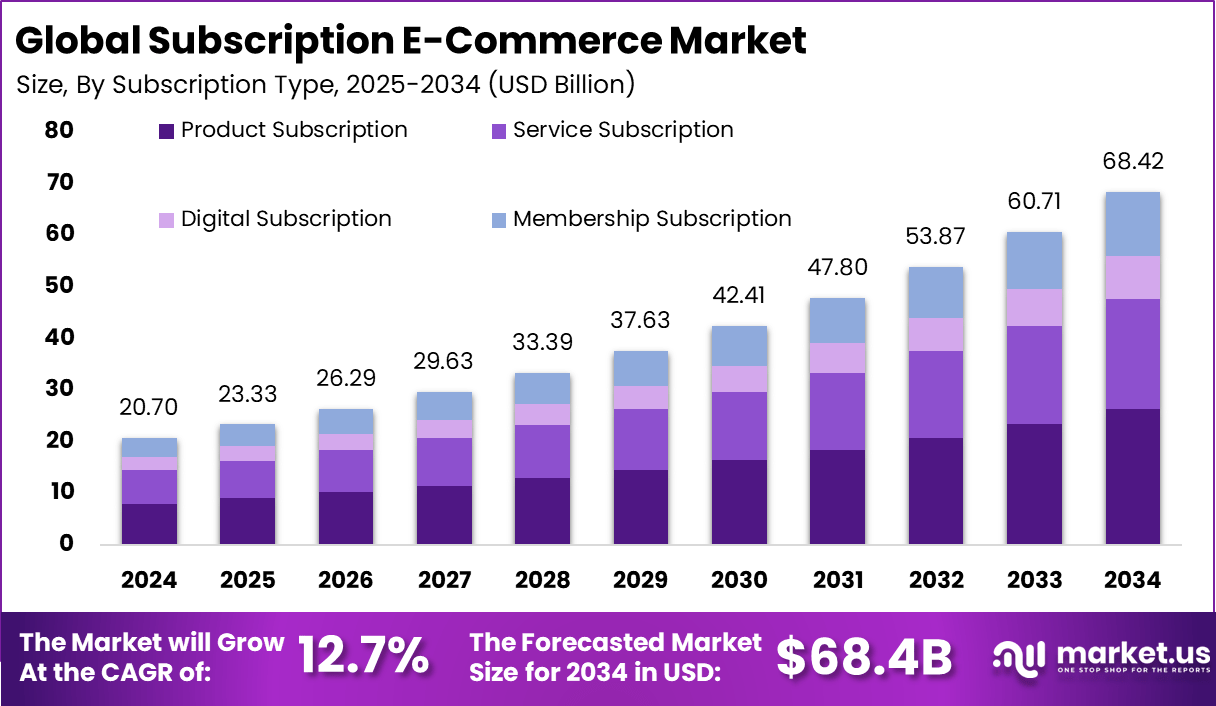
(source: market.us)
Online Gaming Subscription Services Market Statistics
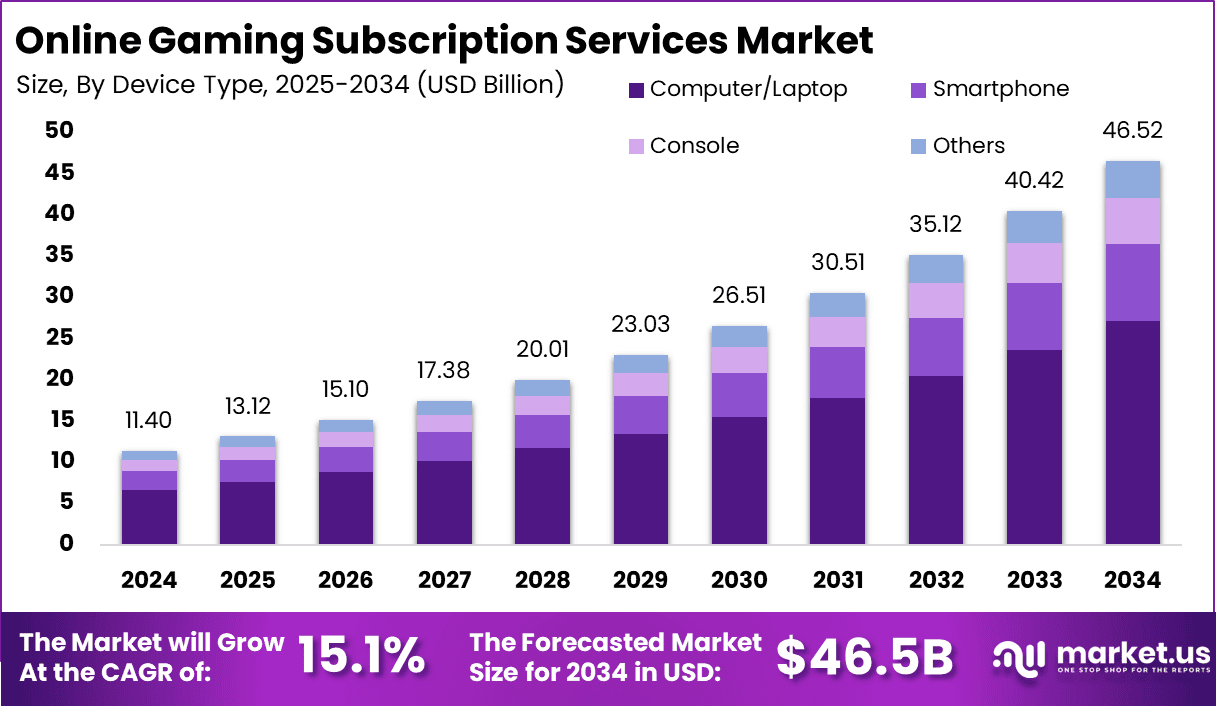
- The Global Online Gaming Subscription Services Market is set to rise from USD 11.4 Billion in 2024 to about USD 46.52 Billion by 2034, with a strong 15.1% CAGR during 2025–2034.
- In 2024, Asia-Pacific led with over 41.2% share, generating USD 4.6 Billion, supported by mobile-first economies and growing digital adoption.
- China contributed USD 1.88 Billion in 2024 and is expected to grow at a 16.4% CAGR, driven by broadband expansion and a strong domestic gaming ecosystem.
- By device type, Computer/Laptop gaming held 58.4% share, reflecting high-performance gaming demand and the popularity of subscription-based PC platforms.
- Among genres, Action games dominated with 24.1% share, supported by rising interest in immersive, multiplayer, and competitive experiences.
(source: market.us)
Digital Media Subscription Market Statistics
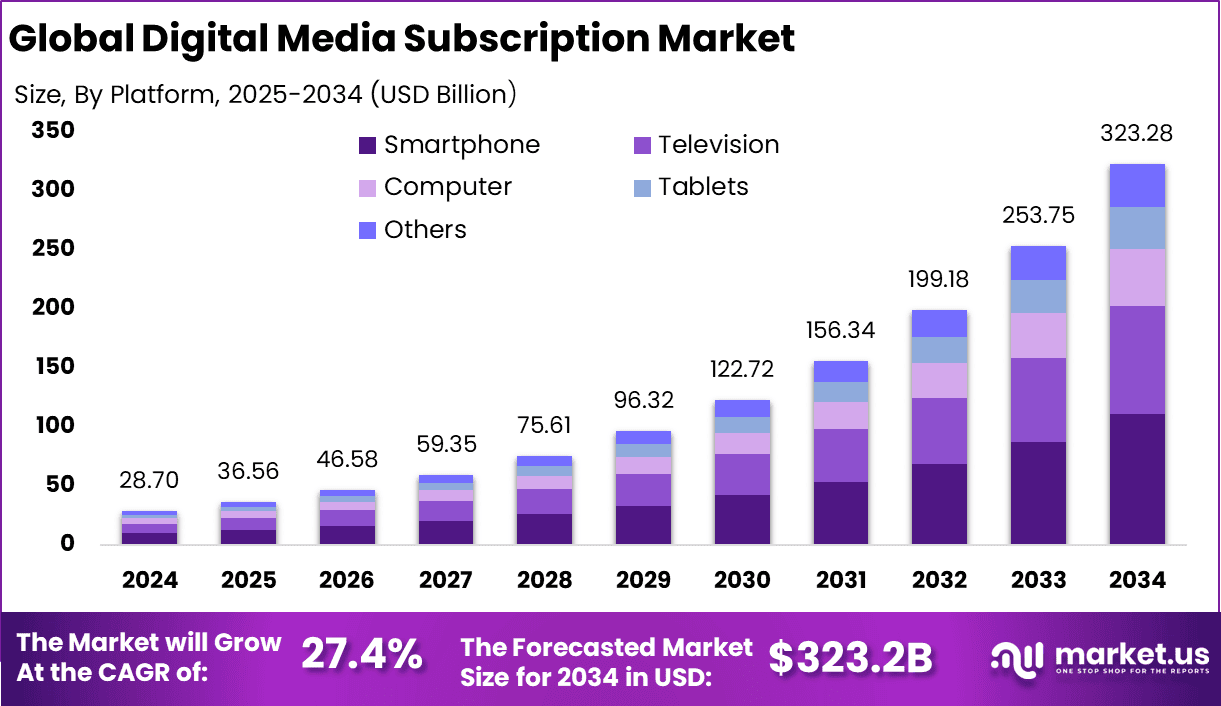
- The market expanded to USD 28.27 Billion in 2024 and is projected to reach USD 323.28 Billion by 2034, at a strong CAGR of 27.4%.
- North America led with 34.8% share in 2024, generating USD 9.9 Billion, supported by high digital adoption.
- The U.S. alone contributed USD 7.9 Billion, showing a CAGR of 25.6%, driven by deep digital penetration.
- Video content dominated with a 36.2% share, fueled by demand for streaming and OTT platforms.
- Smartphones accounted for 34.2% share, reflecting mobile-first user behavior and app-driven access.
- Marketing & Advertising was the top application, holding 38.6% share, as brands leveraged digital for targeted campaigns.
- The Monthly payment model captured 35.6% share, showing preference for flexible recurring cycles.
- Tiered subscriptions led with 42.4% share, supported by demand for customizable access levels.
- The Entertainment sector held 28.5% share, reflecting strong integration with streaming, audio, and live content.
(source: market.us)
Video-on-Demand (VoD) Subscription Market Statistics
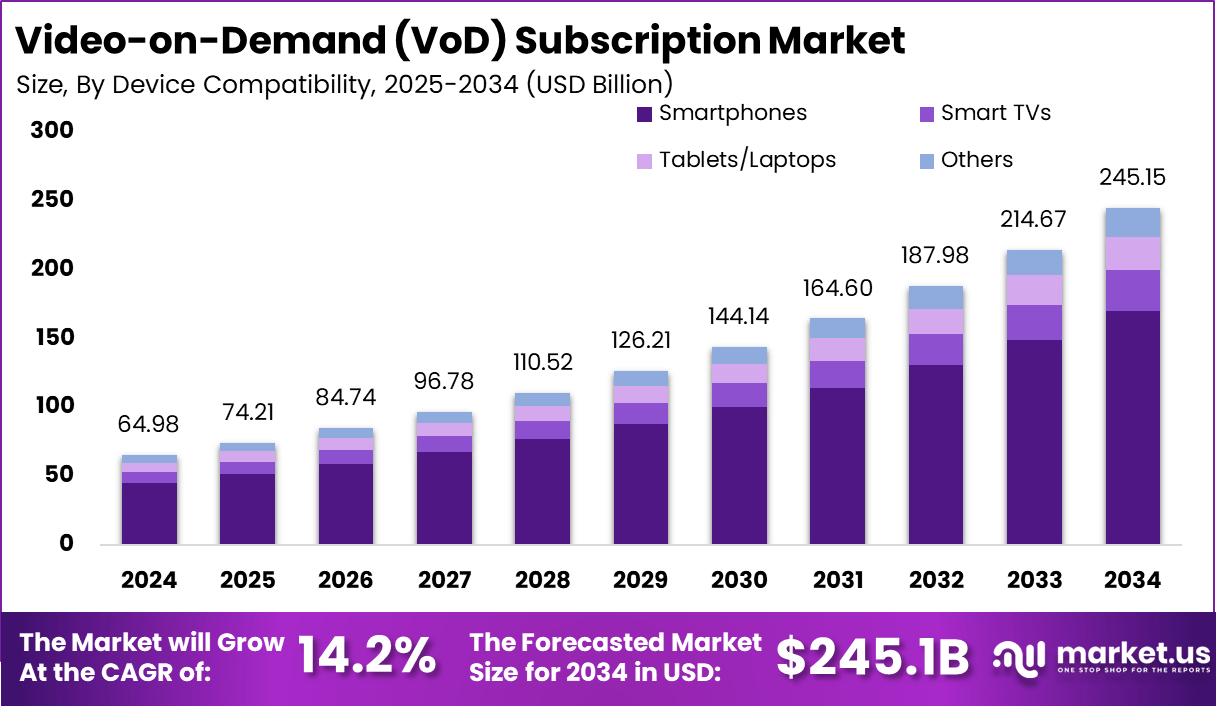
- The market reached USD 64.98 Billion in 2024 and is projected to hit USD 245.15 Billion by 2034, with a CAGR of 14.2%.
- Asia-Pacific (APAC) led with 43.7% share in 2024, generating USD 28.39 Billion, supported by fast digital adoption.
- China contributed USD 11.33 Billion in 2024 and is expected to grow at a 15.3% CAGR, driven by local content and mobile video demand.
- Movies held the largest content share at 41.2%, showing strong consumer preference for film-based entertainment.
- Smartphones dominated device use with a 69.4% share, reflecting mobile-first viewing and affordable high-speed internet.
(source: market.us)
Content Creator Economy Market Statistics
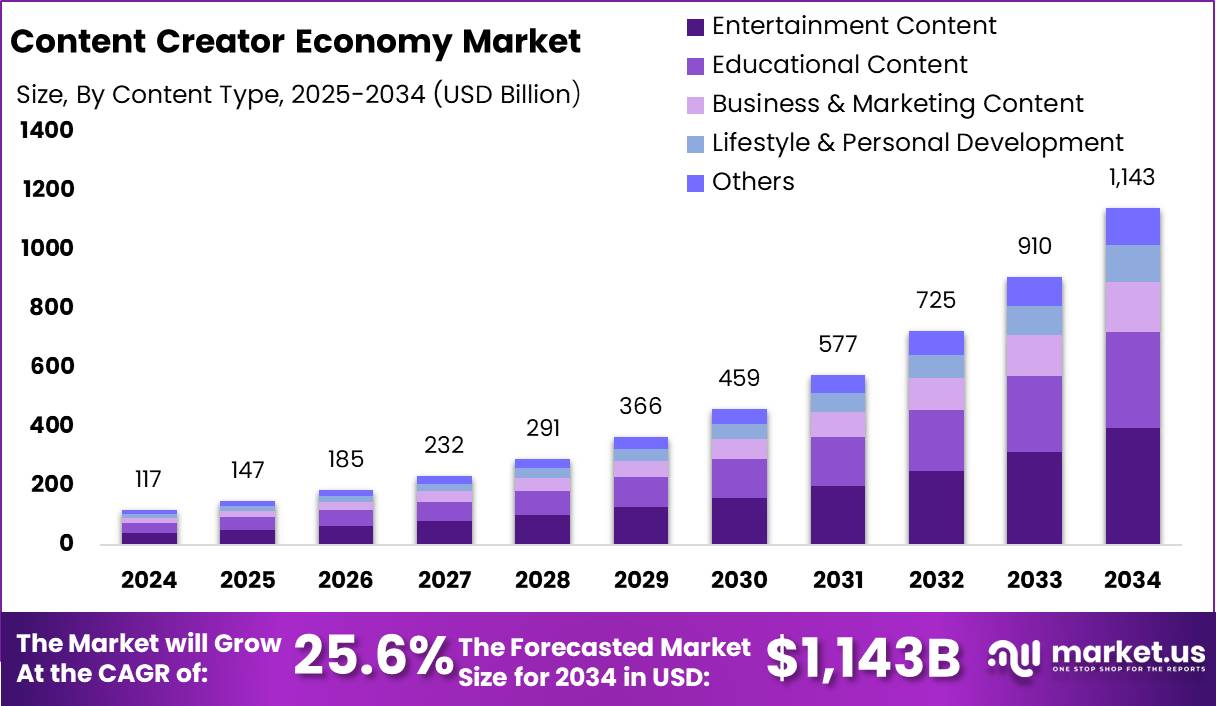
- The market is projected to grow from USD 117 billion in 2024 to USD 1,143 billion by 2034, registering a strong CAGR of 25.6%, driven by rising monetization tools and global content demand.
- The U.S. market reached USD 35.31 billion in 2024, expanding steadily at a 24.2% CAGR, supported by platform maturity, brand collaborations, and creator-first policies.
- Entertainment content held over 34.7% market share, reflecting its central role in driving engagement and audience retention across creator platforms.
- North America captured 37.5% share, generating USD 43.8 billion, owing to early adoption, diverse revenue models, and strong creator-brand ecosystems.
- Video-based platforms accounted for 29.5%, led by growing viewership, short-form content trends, and integrated monetization features.
- Influencers and social media personalities led the creator type segment with 38.8%, underscoring their dominance in content distribution, brand partnerships, and audience trust.
Advantage
- The subscription model generates predictable and recurring revenue, allowing businesses to plan finances and investments with greater confidence.
- It fosters long-term customer loyalty by building ongoing relationships rather than one-off transactions, increasing customer retention.
- The business benefits from scalability, as acquiring more subscribers lowers the average cost of service and boosts profitability.
- Customer lifetime value improves since subscribers tend to stay longer and spend more over time than occasional buyers.
- Inventory and operational planning becomes more accurate due to predictable demand patterns from subscription renewals.
Disadvantage
- High customer churn rates are a challenge, as subscribers can easily cancel at any time, requiring constant effort to maintain engagement.
- Continuous innovation is necessary to keep subscribers interested, which can strain resources and increase costs.
- Initial customer acquisition can be difficult because potential subscribers may hesitate to commit to recurring payments.
- Growing competition in the subscription market makes it harder to differentiate and maintain market share.
- Early-stage subscription businesses may face unpredictable cash flow until a stable subscriber base is established.
Investment Opportunity
- Subscription businesses attract investors due to their steady and recurring revenue streams, which reduce financial risk.
- Businesses with strong metrics like low churn and high monthly recurring revenue (MRR) are considered attractive investments.
- The scalable nature of subscription models allows investors to benefit from rapid growth as customer bases expand.
- Emerging markets and digital platforms create expanding opportunities for subscription-based services globally.
- Investors increasingly use revenue-based financing targeting future subscription income for flexible funding solutions.
Business Benefit
- Subscription models ensure consistent cash flow, reducing revenue volatility and supporting stable operations.
- They drive higher customer retention, lowering marketing costs by focusing on maintaining existing client relationships.
- Personalized customer experiences become possible through continuous engagement and data insights.
- Predictable revenue enables better business forecasting and resource allocation.
- Subscription offerings create recurring revenue streams from products or services that would traditionally generate one-time sales.
Sources:
- https://www.namiml.com/blog/7-numbers-global-subscription-economy
- https://whop.com/blog/subscription-statistics
- https://subsgrowth.com/2025/01/07/2025-state-of-subscriptions-growth/
- https://sellcoursesonline.com/subscription-economy-statistics
- https://www.soocial.com/subscription-economy-statistics/
- https://adapty.io/blog/9-subscription-trends-dominating-2025/
- https://billingplatform.com/blog/7-key-advantages-of-enterprise-subscription-management
- https://gocardless.com/en-us/guides/posts/5-benefits-of-a-subscription-business-model/
- https://www.enveu.com/blog/ott-statistics-you-need-to-know
- https://explodingtopics.com/blog/video-streaming-stats
- https://scoop.market.us/streaming-services-statistics/
- https://www.talkwalker.com/blog/social-media-statistics
- https://www.socialpilot.co/blog/social-media-statistics
- https://digitalcontentnext.org/blog/2025/06/05/digital-subscription-trends-q1-2025-bundling-ad-supported-growth-and-market-shifts/
- https://www.digitalroute.com/blog/recurring-revenue-statistics/
- https://www.cashfree.com/blog/trends-in-subscription-economy-stats-for-2025/
- https://buildfire.com/app-statistics/
- https://www.businessofapps.com/data/app-subscription-data/
- https://www.revenuecat.com/state-of-subscription-apps-2025/
- https://recurly.com/content/state-of-subscriptions-report/
- https://www.linkedin.com/pulse/paid-subscription-trends-2025-growth-retention-acquisition-strategies-9yxne/
- https://speakerdeck.com/usmarketreports/subscription-economy-market-soar-to-usd-2129-dot-92-bn-by-2034
- https://www.londondaily.news/subscription-economy-market-to-grow-by-usd-2129-9-bn-by-2034/